
|
|
PRINT » |
|
|
E-MAIL THIS PAGE » |
|
|
CLOSE THIS WINDOW » |
Grapevine Phenology Revisited
Using growth stages to improve vineyard management
Grapegrowers have long recognized that bud burst does not occur on the same calendar date each year. Documentation of bud burst dates for each vineyard block should be a routine part of every grower’s annual management practices.
Bud burst dates allow growers to compare the current season with past seasons and provide an estimate for other grapevine growth stages to come. Many growers are good about recording bud burst dates but will neglect to record other important growth stages. All growers need to recognize that collecting data about important phenology benchmarks can help them make better decisions in the vineyard throughout the growing season.
Tracking grapevine phenology
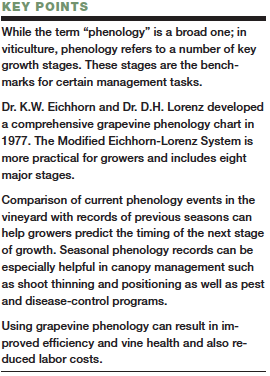
Phenology is the study of natural changes or growth and natural development of an organism and its relation to seasonal changes in climate. In viticulture, we are mostly referencing a limited number of key growth stages that are used for benchmarks for implementation of vineyard-management tasks including canopy management, vineyard nutrient monitoring and pest and disease prevention. The growth stages or phenology events most commonly referred to include bud burst, bloom, fruit set, cluster closure, véraison and fruit maturity (harvest).
There are two reasons for recording grapevine phenology:
1. To implement vineyard-management practices based on current growth stages, resulting in improved efficiency, reduced labor costs and improved vine health.
2. To predict more accurately the onset of growth stages in the current season based on historical data, whereby management practices can be best timed for improving efficiency.
Timing is everything in the vineyard
Grapegrowers use phenology as the indicator for initializing virtually all vineyard-management practices. Many growers begin a protective fungicide program when shoots are just 2 inches long. At bloom, growers sample leaf tissue for nutrient analysis and start to introduce systemic fungicides into their spray programs. At véraison, growers have a second opportunity to sample leaf tissue for nutrient status and can begin to finalize crop estimates for the winery.
 Efficiency of vine canopy management is most notably impacted by grapevine phenology. The task of shoot thinning and positioning is tightly linked to a specific growth period in order to achieve efficiency with labor. If shoots are 2 to 4 inches long, for example, unwanted “sucker” shoots can easily be removed from trunks and non-count shoots from cordons or fruiting canes. However, it may be too early for all shoots to have pushed on the vine, and the crew may have to follow up later with a second pass. Labor efficiency is likewise reduced if shoot removal is performed after the base of shoots have begun to lignify, which makes removal slower. Therefore, finding the “sweet spot” in growth stage for implementation of each vineyard-management practice, as well as the ability to predict that window of opportunity, is critical.
Vineyard pest and disease control programs are implemented with great consideration to grapevine phenology. Growers who have read articles or attended talks by grape pathologists such as Dr. Wayne Wilcox of Cornell University will recall that the greatest window of disease susceptibility is from the period beginning two weeks before bloom and extending four weeks past fruit set. This is the time when growers should be using their best products and canopy-management practices for preventing fungal diseases on the fruit and the canopy. Additionally, a fungicide with a long pre-harvest interval (PHI), such as mancozeb (with a PHI of 66 days), must be taken out of a spray program based not on calendar date, but on a phenological indicator. In 2017, for example, growers in Texas stopped using mancozeb products a full two weeks earlier than average due to record-early bud burst dates.
The life cycles of grapevine insect pests also are tied closely to grapevine phenology. A grape berry moth, for example, must have a young flower or berry cluster to lay eggs in to ensure a food source for its larvae. If egg laying occurs too far before bloom, survival of the next generation will be impacted. Research by Teixeira, Mason and Isaacs at Michigan State University showed that the majority of adult males entered commercial vineyards from approximately 150 to 750 growing degree-days (GDD), with the GDD accumulation beginning March 1 (base temperature 47° F). Additional work by Mason and others found that it was preferable to use the bloom date of a common wild grape species (Vitis riparia) as the beginning of GDD accumulation for grape berry moth emergence and egg laying instead of using a calendar start date.
The use of a phenology-based start date for GDD accumulation based on an indicator species common to a region is referred to as a “biofix” date. This makes sense so long as the indicator date is consistent for predicting the emergence of the pest each year. In a project I worked on at Texas A&M University, we concluded that male grape berry moth emergence in the Gulf Coast region of Texas was between 456 and 517 GDD after bud burst of Blanc Du Bois, a common commercial bunch grape in that region. Models such as these can be developed in new and existing grapegrowing regions, but not without careful records of grapevine phenology to accompany insect trapping data.
What are the most important phenology stages to record?
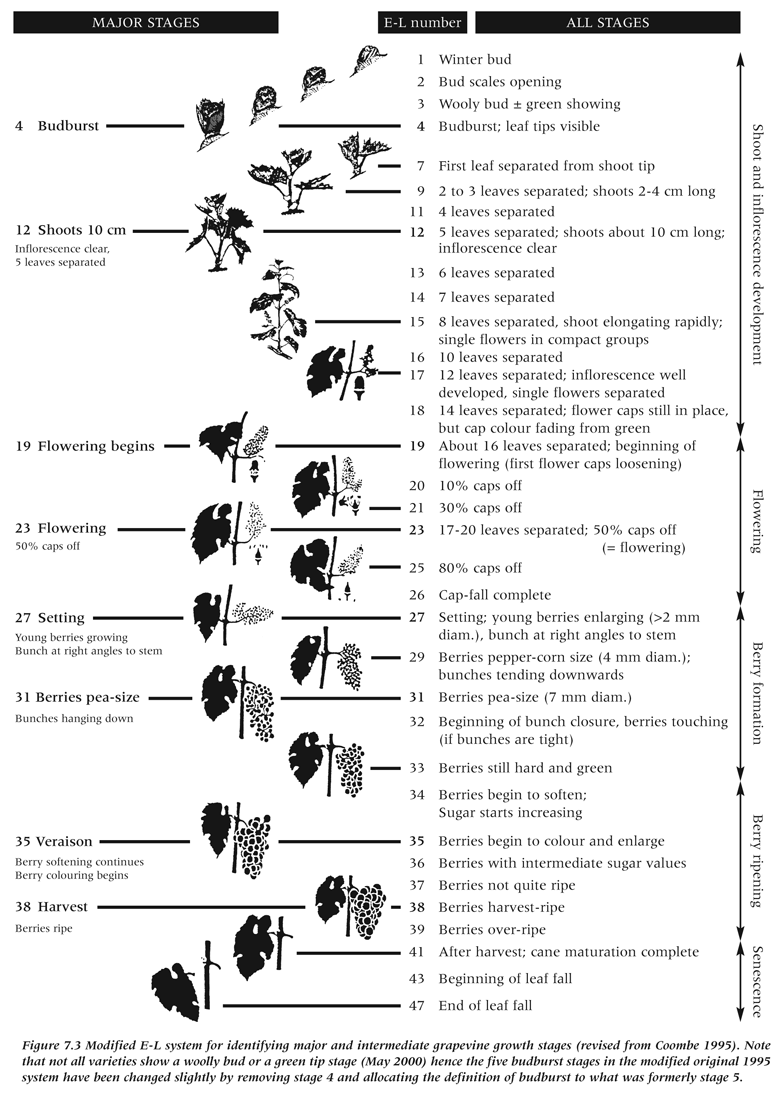
The exact number of phenology stages or “events” to record will vary depending on the objectives of the grower. The most complete grapevine phenology chart was developed by Dr. K.W. Eichhorn and Dr. D.H. Lorenz in 1977. It was modified in 1995 by B.G. Coombe and then revised in 2004 by P. Dry and Coombe in what is commonly known as the Modified Eichhorn-Lorenz (E-L) system.
 Researchers still use the original E-L System when collecting phenology data. However, the abbreviated version is much more practical for commercial use. Eight major stages are listed on the Modified E-L system that I, as a viticultural consultant, recommend all growers record: bud burst, shoots reaching 10 cm, flowering begins, flowering, setting, berries pea size, véraison and harvest. A graphical comparison of these current phenology events overlaid on that of the previous seasons can serve as an aid in predicting the timing of the next stage, based on historical comparison relative to accumulation of GDD.
Factors affecting phenology
In general, newly planted vines or vines in their third leaf or younger may demonstrate phenology trends that are not consistent with observations in established vines (fourth leaf or older). Young vines tend to have shallower root systems that are more sensitive to fluctuating conditions in the soil surface, including temperature and moisture. I have observed vineyards of mixed varieties coming into their second leaf that had bud burst dates very close to each other in varieties that normally would differ in bud burst dates by as much as 10 days in mature vineyards. Furthermore, if a grower implements delayed pruning practices on white grape varieties with the goal of achieving later bud burst, the bud burst dates could end up being similar to late-budding red varieties that were pruned a month prior. I would recommend recording the final pruning dates, especially if timing strategies vary for different grape varieties on one site.
 Tools for tracking phenology
Tracking of phenology can easily be integrated into a routine scouting program for a vineyard. A laminated version of the modified E-L stages can be used as a reference. Numerical reference points in vineyard scouting records can help a grower determine if management practices were carried out at the appropriate time and indicate where improvements can be made in the future. Any disease or insect pressure recorded during vineyard scouting can also be linked to phenology to help growers better prepare for and prevent the same problems in future seasons. Just noting a calendar date alone will not be as effective.
One of the most limiting factors for collecting a complete data set for seasonal phenology is the need for manual input and interpretation. To my knowledge, there are currently no sensors or software that can record grapevine phenology automatically. Therefore, just as with a grower’s pesticide and fertilizer records, there will need to be manual input for these data points. This job is best assigned to a vineyard manager or an intern who is dedicated to recording this data on a weekly basis. If the task is part of someone’s job, it is more likely that appropriate records will be entered.
Vines can grow up to 12 inches per week in warm climates, which makes weekly input necessary to prevent gaps in data. Perhaps a camera or scanning device will be developed to automate this process and allow for predictive models for grapevine phenology without human input of data in the future. Until then, growers should print out the chart and make record-keeping of grapevine phenology a routine part of their weekly management plan.
Fritz Westover, owner of Westover Vineyard Advising, is based in Houston, Texas. He specializes in vineyard consulting, research and education in the south and southeastern United States and maintains a practical grapegrowers blog and grower resources at vineyardadvising.com.
References
Dry, P. and Coombe, B. 2004. Revised version of “Grapevine growth stages—The modified E-L system” Viticulture 1 – Resources. 2nd edition. Winetitles.Mason, K. S., C. Roubos, C. R, Teixeira, L. A. F., Isaacs, R. 2016. Spatially Targeted Applications of Reduced-Risk Insecticides for Economical Control of Grape Berry Moth, Paralobesia viteana (Lepidoptera: Tortricidae). J. Econ. Entomol. 109 (5): 2168-2174.
Teixeira, L. A. F., Mason, K. S., Isaacs, R. 2009. Control of grape berry moth (Lepidoptera: Tortricidae) in relation to oviposition phenology. J. Econ. Entomol. 102 (2): 692-698.
|
|
PRINT » |
|
|
E-MAIL THIS ARTICLE » |
|
|
CLOSE THIS WINDOW » |
